Volume analysis tools
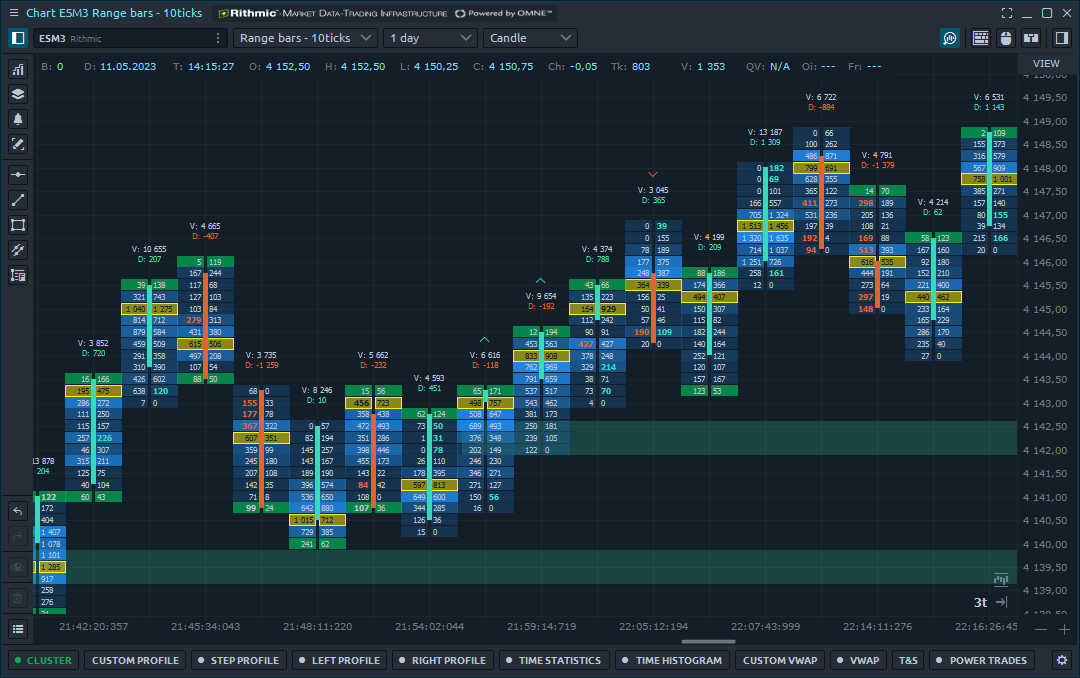
Cluster chart
Gain full market insight using price, volume, time and order flow on a single Cluster chart. Switch between various display modes to find the imbalance of buyers and sellers
- Various data visualization
- Coloring modes
- Buy & Sell Trades
- Clear view on liquidity levels
- Delta chart
- Volume
Volume profiles
Get to know how the total Volume, Buy & Sell trades, as well as Delta were distributed over the selected period
Step & custom
Set a certain step of volume profile to see the distribution of trades, delta or Buy & Sell volumes for any time step. Get accurate information on a fair price and point of control for any selected time range on the chart.
Left & Right Volume Profile
Place volume profiles on the left and right sides of the chart and analyze different time periods simultaneously on one combo profile


Time statistics & histogram
Analyze an extended volume data for each individual bar that is presented in the table form or as the histogram. Switch between 20+ data types in one click to see market activity from different angles
- Volume & Number of Trades
- Separate Buy & Sell Data
- Delta & Filtering Volume Data
- Average & Maximum Trade Size
Time histogram
shows the volume data as a vertical histogram for each bar. Thanks to this, you can visually compare the size of volume bars relative to each other
Time statistics
provides volume data in a table form for every single bar on the chart


Buy the Quantower All-in-one license and get all these functionalities (and more) starting from $70 monthly
An All-in-one license gives you access to even more professional features, including all updates and future releases of new advanced functions
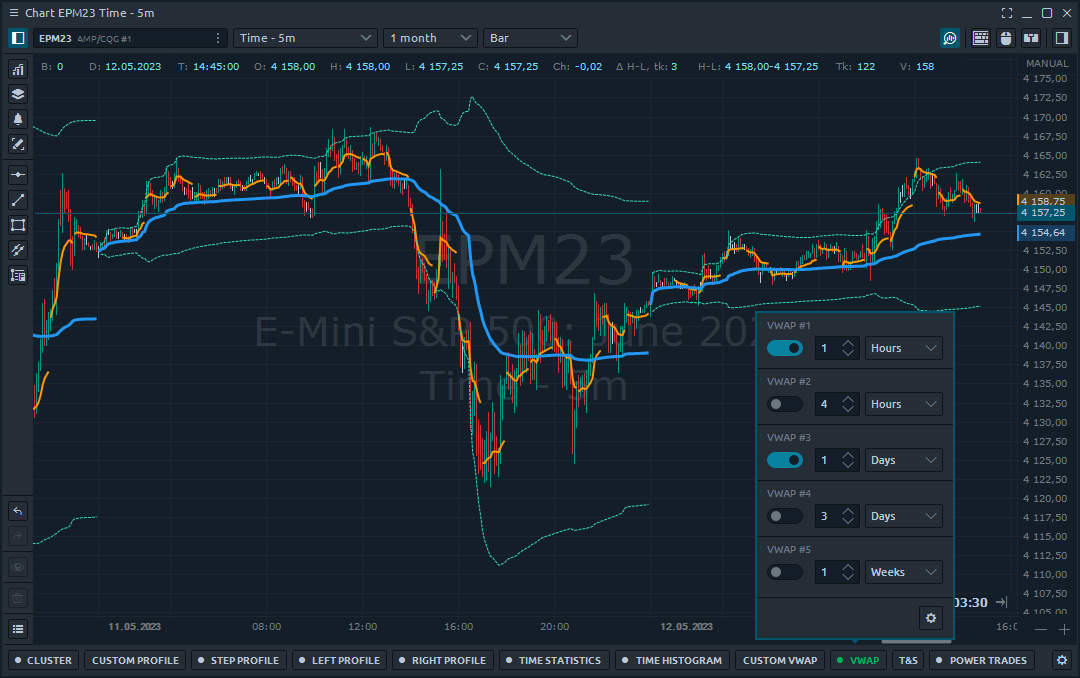
Volume weighted average price (VWAP)
Reveal a “benchmark” price for an asset for any period of the trading day or session. Average price is weighted by volume for evaluating the overpaying or underpaying of current price relative to the VWAP price
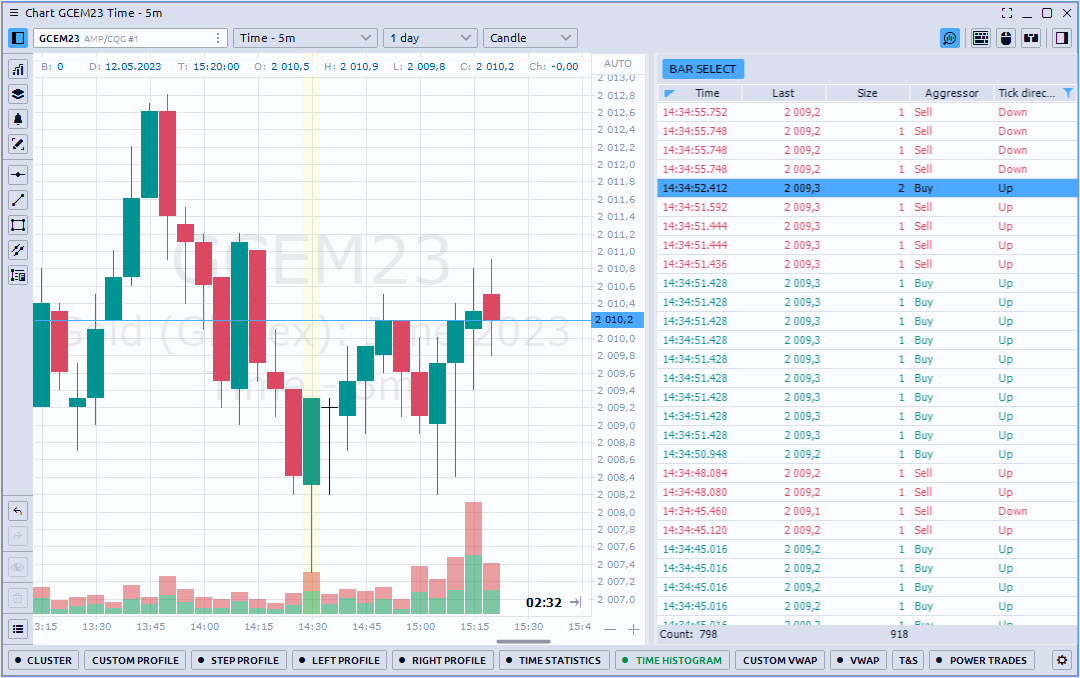
Historical Time&Sales
Get the full information on how trades were executed, in what order, volume and at what price. Just select the historical bar and you will get the list of all executed trades in the Time & Sales view